Mini-Challenge 1: Graph Analysis

Center for Global Cyber Strategy (CGCS) researchers have used the data donated by the white hat groups to create anonymized profiles of the groups.One such profile has been identified by CGCS sociopsychologists as most likely to resemble the structure of the group who accidentally caused this internet outage. You have been asked to examine CGCS records and identify those groups who most closely resemble the identified profile.
Data
Data for this mini-challenge consists of the following. This data is described in more detail in the download file.
Note: In the sample, data channels were each in their own file. In the full release these have been merged into a single file.
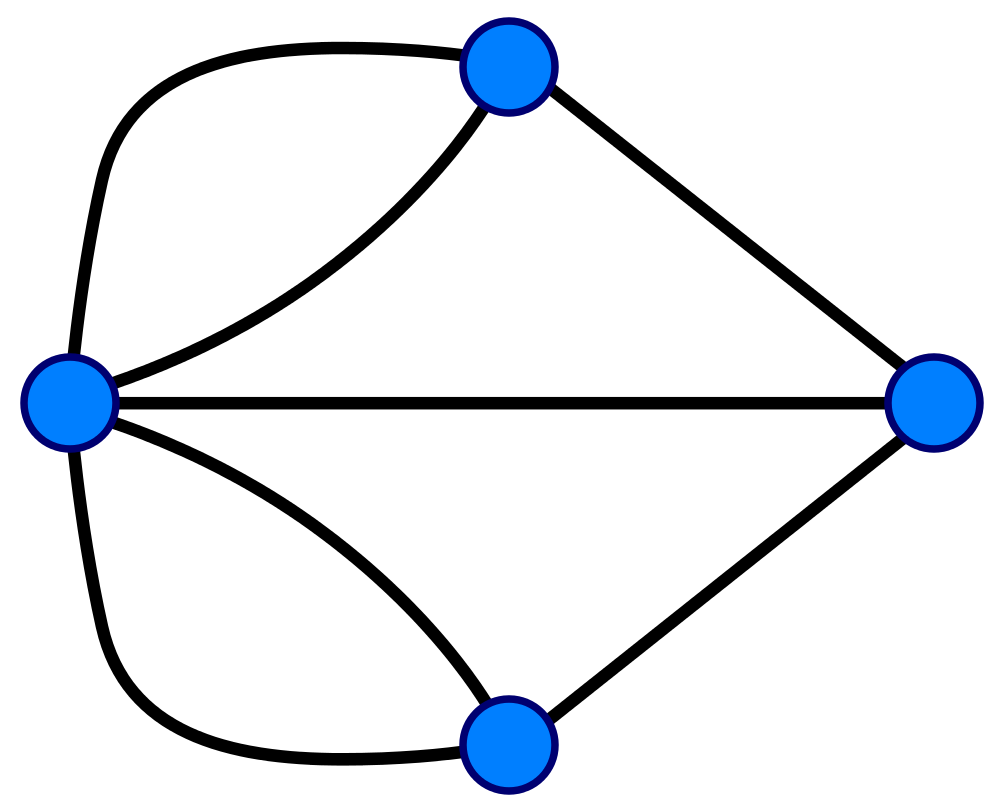
- A subgraph template representing the structure of the group identified by CGCS, in CSV (comma-separated values) format.
- Several candidate subgraphs, in CSV format.
- A very large graph in CSV format. This graph is downloaded separately. Instructions for how to access it are available in the data description.
- A list of “seeds”, or IDs that can provide starting points for exploring the large graph.
Note: Having difficulty with scale when working with the very large graph? Feel free to ask questions about approaching this challenge. Answers to the questions we receive will be posted on this page for all contestants to see.
Tasks and Questions
- Using visual analytics, compare the template subgraph with the potential match provided. Show where the two graphs agree and disagree. Use your tool to answer the following questions:
- Compare the five candidate subgraphs to the provided template. Show where the two graphs agree and disagree. Which subgraph matches the template the best? Please limit your answer to seven images and 500 words.
- Which key parts of the best match help discriminate it from the other potential matches? Please limit your answer to five images and 300 words.
- CGCS has a set of “seed” IDs that may be members of other potential networks that could have been involved. Take a look at the very large graph. Can you determine if those IDs lead to other networks that matches the template? Describe your process and findings in no more than ten images and 500 words.
- Optional: Take a look at the very large graph. Can you find other subgraphs that match the template provided? Describe your process and your findings in no more than ten images and 500 words.
- Based on your answers to the question above, identify the group of people that you think is responsible for the outage. What is your rationale? Please limit your response to 5 images and 300 words.
- What was the greatest challenge you had when working with the large graph data? How did you overcome that difficulty? What could make it easier to work with this kind of data?
Clarification Requests
1. Problems downloading data
Question
I’m having trouble downloading the large files when I click on the link in the form. How do I download the files?
Clarification
Links in the form must be opened in a new browser tab. Clicking on the links within the form may not work.
3. Strange data values
Question
There are travel records with negative weights. What does this signify?
example:
492850 6 625756 1641600 -1 5 3 22 156 -25 -111
Clarification
There is no special significance to these values. Datasets can be messy and contain errors and unknown values.
4. Column confusion
Question
There is a mismatch in the descriptions of eType 0 and eType 1 in the PDF documentation for mini-challenge 1 (CGCS-GraphData-Readme.pdf). Which is correct?
Clarification
The table on the first page of the PDF was incorrect. Emails are designated as eType 0 and calls are designated as eType 1.
Download the Submission Form and the Data
Note: Links in the form must be opened in a new tab.
VAST 2020 Submission Instructions
Please provide a valid address in order to get access to the data. Your email address may be used if we need to contact you with important information about the Challenge.
Sample Data
Sample data for this mini-challenge is available in order to give teams a small set to prepare their tools and work through ingesting the data.
Note: Data from multiple channels is provided in separate files in this sample.