Mini-Challenge 2: Object of the Search

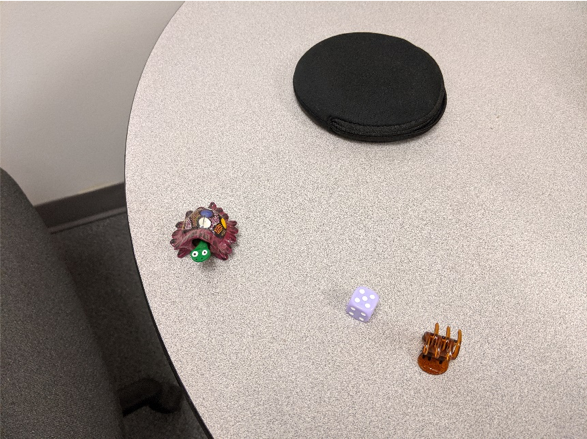
With your help, the Center for Global Cyber Strategy (CGCS) searched the vast graph of offline records and narrowed its list of possible groups involved in the accidental cyber event. Further analysis of the cyber event has given a strong indication that a subgroup of eight individuals were behind the bug. The CGCS has received a tip that this group rarely meets in person and instead they use a special item—a totem—as a secret signal of their affiliation. This item is unremarkable to those who are not part of the group; it could easily be confused for a free item handed out at a conference. The CGCS gathered all records associated with the group from their offline archives including text and photos that potential group members posted on the Y*INT social media platform. Investigators at the CGCS need your help analyzing the contents of those records to look for clues to the identity of the eight individuals.
Data
You will be provided with the following:
- A set of training images for a set of many objects that have been distributed at conferences the group frequents. If you choose to train your own models, this training data will be useful.
- The primary data set for analysis. This data contains files for each of 40 different people who are considered potential members of the white hat group who accidentally caused the outage.
Image Data
The image data has been run through a basic machine learning model to identify objects contained in the image. Each image file has an associated data file that lists the objects the algorithm identified, the location within the image, and the confidence in that result. You may use this object recognition data if you wish, or you may use your own model.
Text Data
Some images are accompanied by text captions, and other entries may be text alone. This text has not undergone any special processing.
Tasks and Questions:
Given the images, text, and audio files, as well as machine learning outputs, your goal is to identify, use visual analytics to answer the questions below. Your tasks is to use visual analytics to improve and understand machine learning outputs and apply visual analytics to track provenance, uncertainty, and confidence in machine learning results. Ultimately, you must link multiple data types to identify the group CGCS is seeking.
Examine the outputs from the model – either from the detection results provided or the results from a model you chose. Which objects were identified well by the model and which were not? Please limit your answer to 5 images and 250 words.
Demonstrate your process for using visual analytics to correct for classification errors in the results. How do you represent confidence and uncertainty? How could the correction process be made more efficient? Please limit your answer to 10 images and 500 words.
Characterize the distribution of objects across the forty people.
Which people have which objects? Please limit your answer to 8 images and 250 words
Identify groups of people that have object(s) in common. Please limit your answer to 10 images and 500 words.
Which group do you think is the most likely group with the “totem”? What is your rationale for that assessment? Please limit your response to 5 images and 300 words.
Process question: Did you choose to use the object recognition model results provided or use your own machine learning algorithm? Why did you make that choice? What was the biggest challenge you faced? Please limit your response to 3 images and 300 words.
Clarification Requests
1. Missing data in CSV
Question
Some CSV data files describing images contain missing data values or values in wrong the format, e.g., the x and y coordinates from files Person40_1.csv to Person40_4.csv. Could you explain whether that is intentional for the dataset or maybe some reasons to rerun the machine learning models?
Clarification
The image analysis process used by CGCS has limitations and imperfections. Can your tool help overcome these issues?
2. Ground Truth?
Question
Are there files where the ground truth is provided? The dataset has csv and jpg files and for some of them there are .txt files but not for all of them.
Clarification
The training images are organized in folders based on which object is in each. The file names also contain the name of the object. The training images do not include bounding box data, but you can assume that it was done manually and with good accuracy. The object identified in the training images is perfect accuracy and the accuracy of the bounding box is as good as it can be done manually.
3. What does “score” mean?
Question
Does the score mean possibility of the bounding box contains a real object (any object) OR the possibility of having an object of a particular class within that bounding box?
Clarification
The score represents the detector’s confidence that the bounding box contains the specific object or particular class identified by the label. A higher score indicates higher confidence in the detection.
4. Correcting for Errors
Question
On question 2 What is meant by: " How could the correction process be made more efficient?" Since we don’t have the model and we don’t have ground truth, what is the question asking us to do? Is it to make analysis efficient so that we will have more confidence in the suggestion given based on this analysis?
Clarification
Yes, one aspect of this question is to consider how this model could be made less error-prone so that we have more confidence in its results. But, assuming there will still be errors, a user may need to do some manual correction. How could you make that manual correction process more efficient as well? Consider both perspectives (the model and the human user) as you formulate your answer.